Important parameters
- pch: plotting symbol
- lty: line type
- lwd: line width
- col: plotting color
- las: orientation of axis labels
- bg: background color
- mar: margin size
- oma: outer margin size
- mfrow: number of plots per row, column. Plots filled in row-wise.
- mfcol: number of plots per row, column. Plots filled in column-wise.
Import functions
- plot: make scatterplot
- lines: add lines to plot
- points: add points to plot
- text: add text
- title: add title to axes or plot
- mtext: add margin text
- axis: add axis tick/labels
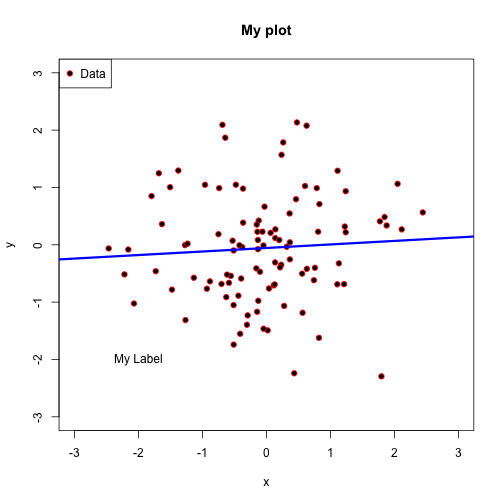
Example 1
x <- rnorm(100)
y <- rnorm(100)
plot(x, y, pch = 21, mar = c(4, 4, 2, 2), col = "red", bg = "black", xlim = c(-3,
    3), ylim = c(-3, 3))
fit <- lm(y ~ x)
abline(fit, lwd = 3, col = "blue")
title("My plot")
text(-2, -2, "My Label")
legend("topleft", legend = "Data", pch = 21, pt.bg = "black", col = "red")
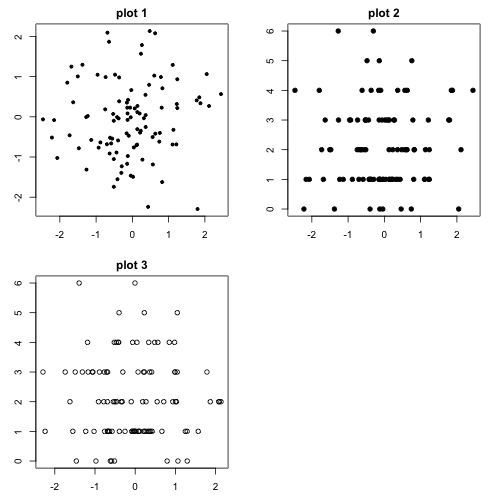
Example 2
To use multiple plots per page, give a mfrow argument to plot. Then the plots will be filled from left to right across the rows. (Specifying mfcol will fill in plots from top to bottom down the
columns. )
z <- rpois(100, 2)
plot.new()
par(mfrow = c(2, 2))
par(mar = c(3, 3, 2, 2))
plot(x, y, pch = 20, main = "plot 1")
plot(x, z, pch = 19, main = "plot 2")
plot(y, z, pch = 1, main = "plot 3")
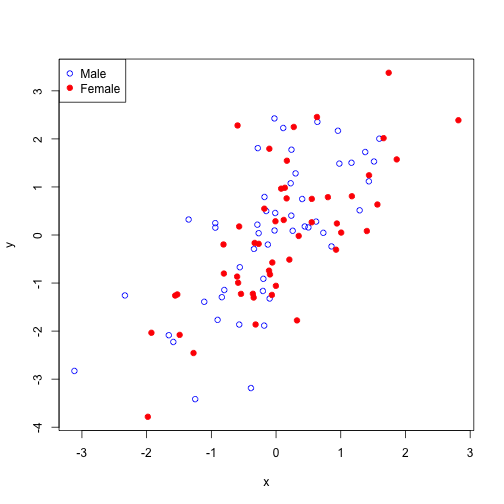
Example 3
The points function is useful for adding points to a plot for different groups.
plot.new()
x <- rnorm(100)
y <- x + rnorm(100)
g <- gl(2, 50, labels = c("Male", "Female"))
str(g)
## Factor w/ 2 levels "Male","Female": 1 1 1 1 1 1 1 1 1 1 ...
plot(x, y, type = "n")  # Draws no points
points(x[g == "Male"], y[g == "Male"], col = "blue", pch = 1)
points(x[g == "Female"], y[g == "Female"], col = "red", pch = 19)
legend("topleft", c("Male", "Female"), col = c("blue", "red"), pch = c(1, 19))
comments powered by Disqus