Mathematical expressions can be included in the plot title or axis labels. For more information, see ?plotmath or run the demo with demo(plotmath).
Here are some quick examples.
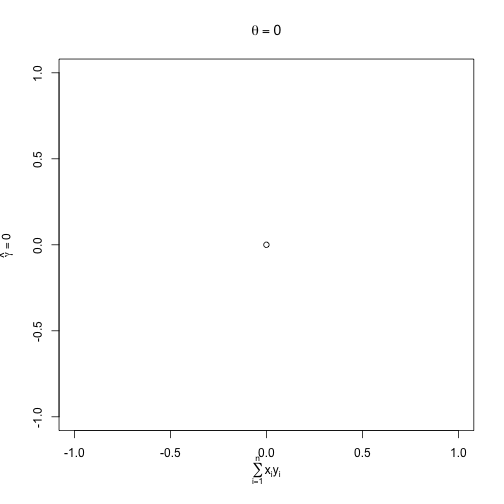
Example 1
plot(0, 0, main = expression(theta == 0), ylab = expression(hat(gamma) == 0),
    xlab = expression(sum(x[i] * y[i], i == 1, n)))
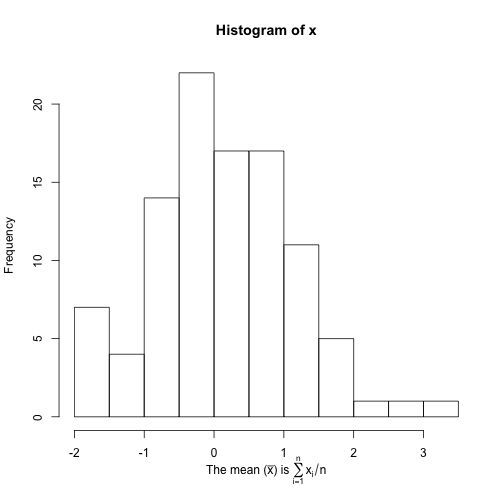
Example 2
Strings can be pasted together with mathematic expressions:
x <- rnorm(100)
hist(x, xlab = expression("The mean (" * bar(x) * ") is " * sum(x[i]/n, i ==
    1, n)))
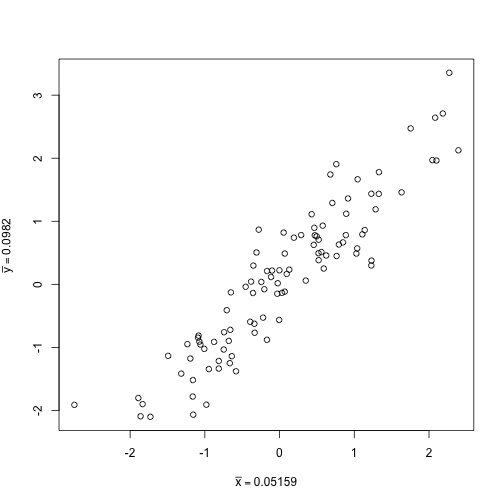
Example 3
The subsitute function can be used to substitute values into a
mathematical expression.
x <- rnorm(100)
y <- x + rnorm(100, sd = 0.5)
plot(x, y, xlab = substitute(bar(x) == k, list(k = mean(x))), ylab = substitute(bar(y) ==
    k, list(k = mean(y))))
comments powered by Disqus